Performance Max campaigns can really drive home the impact of your marketing efforts, by targeting potential customers by any channel necessary, right in the key moments of their conversion journeys. To do that, the campaign needs to have access to the widest possible selection of assets. Parallel to this, performance of campaigns and attribution comprises several key factors, each of which work differently. All and all, keeping a reign on wide scale Performance Max campaigns can quickly get out of hand.
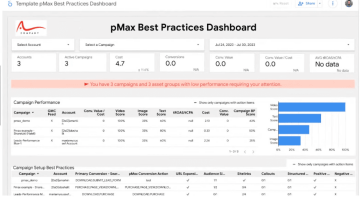
To address this, the customer solutions engineers at Google presented their solution: PMax best practices dashboard. There are several things we want to highlight about it.
The PMax best practices dashboard is built in Looker Studio. Not only is there no additional cost for using a visualisation tool, but for customers familiar with Looker Studio already, there is even less of a barrier of entry.
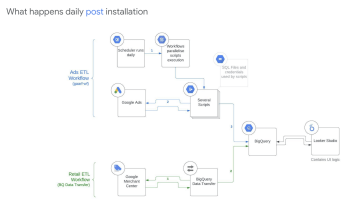
The data is processed by GCP and interpreted using AI algorithms.
This is a custom built solution, by request, done by Google’s own customer solution department. It kept alive and improved by the feedback from customers back to Google.
Now, what can the dashboard do for you?
First, it is a tool for monitoring large scale Performance Max campaigns. While it’s not really possible to manage and attribute each channel in a Performance Max individually, this is the closest thing we can get to fully understanding its function and results. This advantage scales up with size incredibly well. Meaning – the more Performance Max campaigns you have (or plan to have), the more useful will the dashboard reporting be for you.
Secondly, this dashboard is not just a reporting dashboard. It’s a best practices dashboard. It shows you what assets are missing entirely and which can be improved based on Google’s best practices. This will again scale incredibly well with size, and make sure that you are running your Performance Max campaigns with the most optimal setup. It also keeps track of your use of URL expansions, sitelinks, callouts, structured snippets and all other add assets. The dashboard will also show you how your ads look like to customers, along with its performance summary.
Score metrics is a brand new metric, that is a blend of the two previous functionalities. It evaluates the quality of all elements of the ads, and lets you know any room for improvement. This is a metric calculated in GCP and it’s not available in Google Analytics.
The dashboard will also show you how your ads look like to customers, along with its performance summary.
The results are visualised in clear, concise, easy to navigate tables. There are tables of Campaign performances, best practice summaries and ad recommendations, that can be filtered by account structures or individual campaigns.
So, what do you need for this magic and what will it cost? Since the computation happens in GCP, you need to have your account set up and connected to billing. After that, you need a developer token, which is pretty easy to request. Lastly, a Google Ads MCC account. The data can be taken from the whole MCC, or individual sub-accounts.
If this sounds interesting to you, reach out to your favourite online measurement company.


Využijte sílu*
marketingových dat k optimálnímu prodeji
Spojte se s námi
Chcete zjistit skutečný potenciál* svých dat?
Napište nám své kontaktní údaje a my se vám co nejdříve ozveme.


